Getting Started
User Guide
Reference documentation
Development
Getting help and contributing
This gallery contains examples of what PyGMT can do. Click on any example to see the code used to generate it.
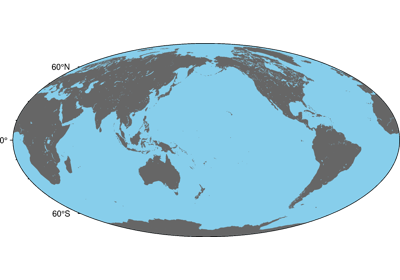
Color land and water
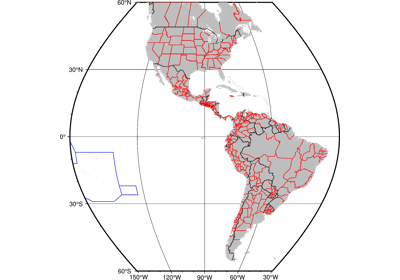
Political Boundaries
Shorelines
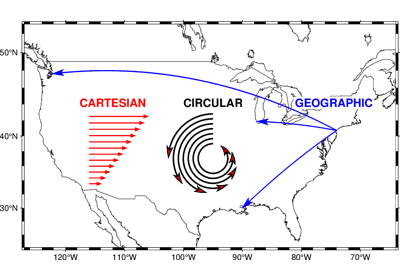
Cartesian, circular, and geographic vectors
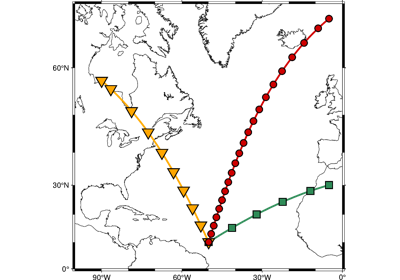
Generate points along great circles
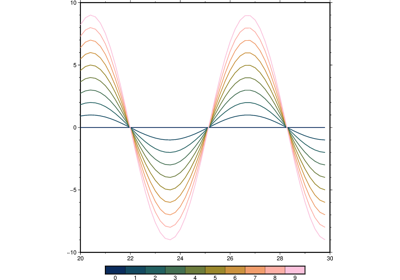
Line colors with a custom CPT
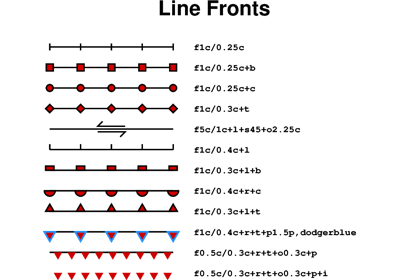
Line fronts
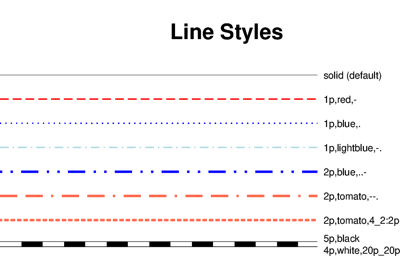
Line styles
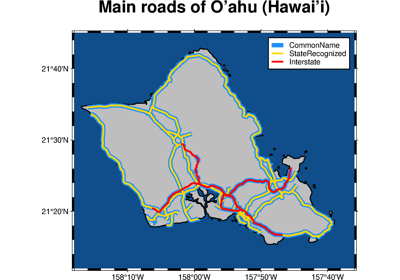
Roads
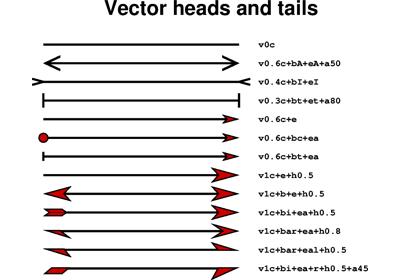
Vector heads and tails
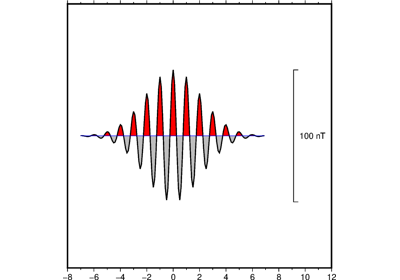
Wiggle along tracks
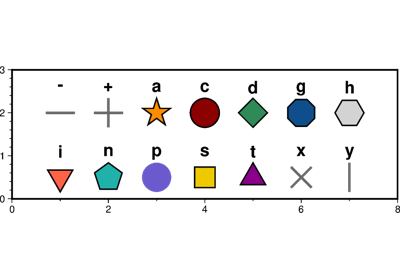
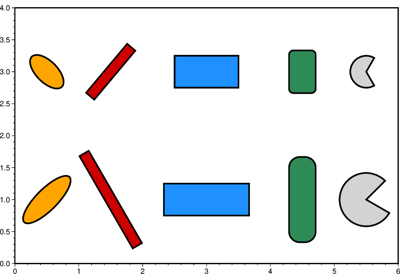
Basic geometric symbols
Color points by categories
Custom symbols
Datetime inputs
Multi-parameter symbols
Points
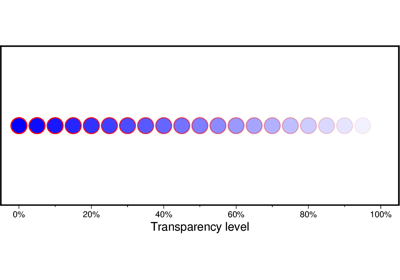
Points with varying transparency
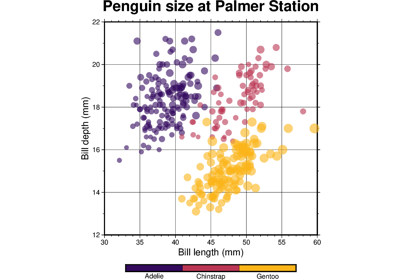
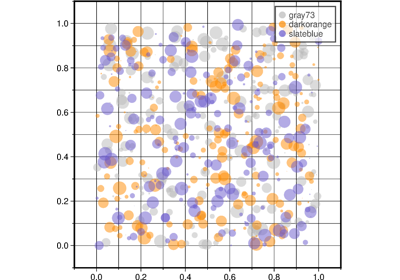
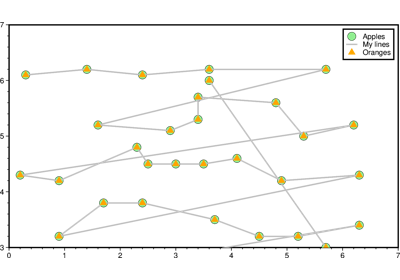
Scatter plots with a legend
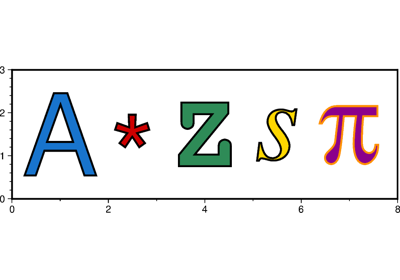
Text symbols
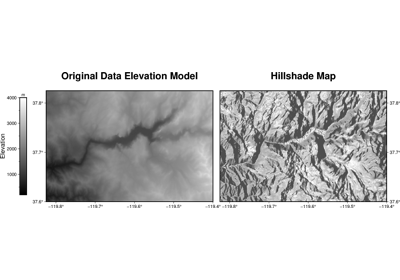
Calculating grid gradient and radiance
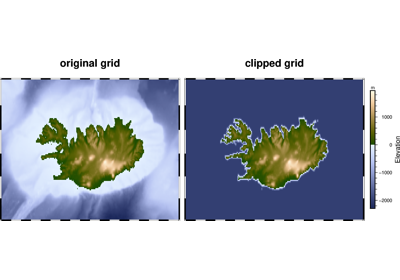
Clipping grid values
Contours
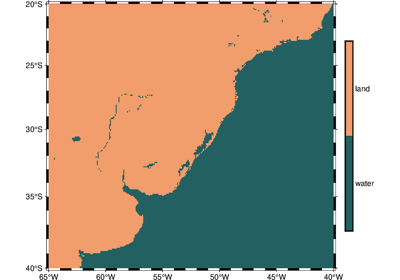
Create ‘wet-dry’ mask grid
Images on figures
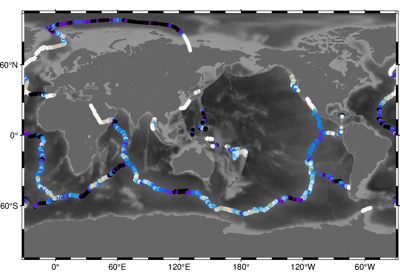
Sampling along tracks
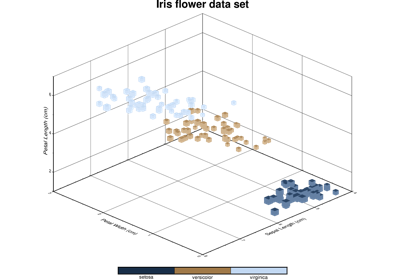
3D Scatter plots
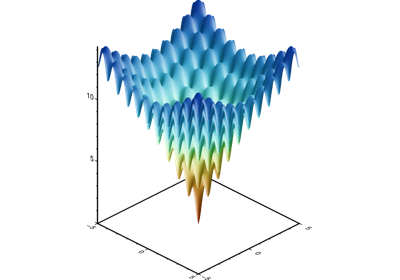
Plotting a surface
Focal mechanisms
Velocity arrows and confidence ellipses
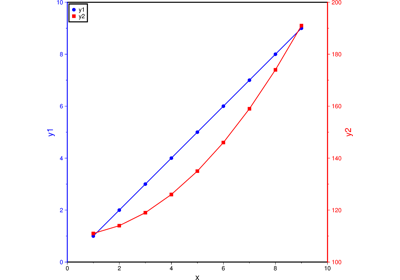
Double Y axes graph
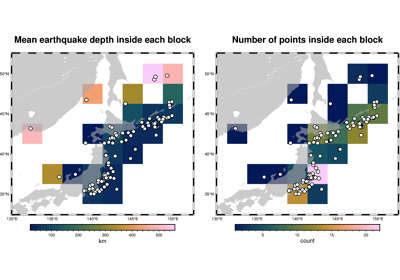
Blockmean
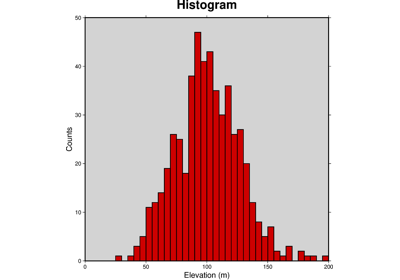
Histogram
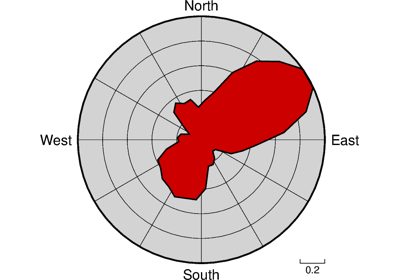
Rose diagram
Colorbar
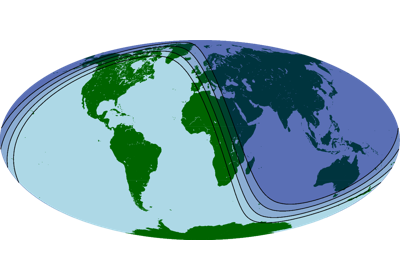
Day-night terminator line and twilights
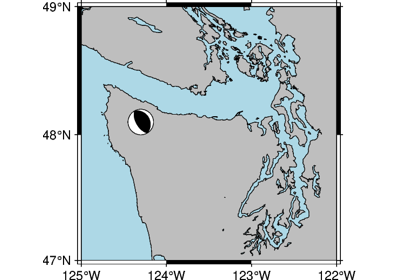
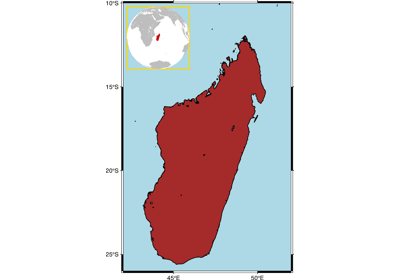
Inset
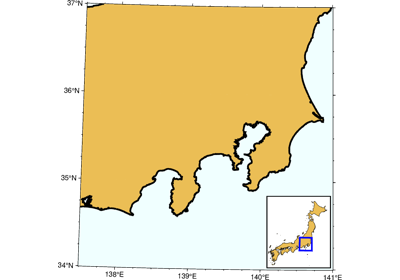
Inset map showing a rectangular region
Legend
Logo
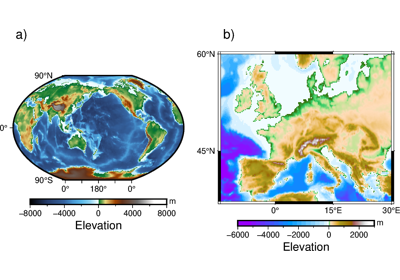
Multiple colormaps
Gallery generated by Sphinx-Gallery